

Google Analytics Glossary for Beginners
Need some help figuring out some things in Google Analytics? We've got you covered with this comprehensive Google Analytics Glossary.
Google Analytics Metrics to Measure UX Success
Top By Myriam Jessier•
Measure and improve user experience with Google Analytics. Here are the most important user metrics to analyze as a UX designer.

This article is a mini Google Analytics crashcourse for UX designers. It is based off of a workshop given in collaboration with User Wizard. User Wizard UX Career Mentoring is a dedicating coaching program for career switchers into the UX industry. Here is their mission in a nutshell:
We do not believe in UX unicorns but we strongly believe in your ability to develop your expertise and an exclusive skill set. We promote uniqueness and celebrate diverse backgrounds in UX: join us on the bright side of the force, become a Use Wizard!

Both qualitative and quantitative research methods play an important role in user experience. Qualitative research methods are for better understanding, and observing users. It focuses on discovering problems within the user experience, or understanding how to fix it. Qualitative studies require a smaller sample size and utilize open-ended questions.
On the other hand, quantitative methods focuses on statistical data to determine the priority or scale of a problem. This can be used to make a comparison or technical analysis, rather than determining a problem or solution. The best strategy is to use a variety of methods in your UX practice.
That’s an interesting question. Ideally, the answer should be: in every project. But ultimately it depends on the type of usability testing you choose. You can get great insights from Google Analytics to help your analysis. Quantitative studies help you optimize user experience in the following cases:


Many UX designers fear quantitative data. Lack of knowledge is holding you back from gathering quantitative feedback.
Many UX designers fear quantitative analysis. Lack of knowledge is holding you back from gathering behavioral metrics. Digital marketers sometimes suffer from the same difficulty of analysis in Google Analytics.
Sometimes, instinct and qualitative research seem more natural. Customers are people after all, not data. And yet, you need to feel comfortable with quantitative data, not just qualitative data. Google Analytics is a calculator, it doesn’t replace you. Quantitative researchers should be complimentary to your other research methods. Mixed methods will often involve knowing how to keep users happy, even when it comes to technical elements like load time. You can gain actionable insights from Google Analytics as a UX expert. Invest some time in getting familiar with the GA interface to get the best of it.
Don’t bring an opinion to a data fight. So, how do you get started with quantitative research? Pick the right metrics. Choose metrics that are easily understood and help guide decision making. If you are wondering what a metric is, let’s take a second to bring you up to speed. If we are talking about the adjective, it’s related to the metric system. This is not our topic today. From a technical standpoint, a metric is a system or standard of measurement. That’s what we care about. A metric is not an objective.
If you want to measure your progress, your performance, your success: you have to pick the right metrics. Behavioral analytics in tools like Google Analytics provides great human insights if you know where to look. You can track usability over time, do cohort analysis and much more. But to have the biggest impact on design, you need to get over the lack of understanding around metrics. Let’s look at an example:
An objective would be to lose weight. A metric to measure your progress would be kilograms. If your weight goes down by x amount of kilos, you know you are on track. This is the example I was told many moons ago. One of my personal metrics is cost per wear. I can buy clothing that is expensive, so long as I wear it long enough to reach my personal target of 3$ per wear. If my dress is 100$, I would need to wear it around 33 times to reach my goal. After that, I no longer feel guilty if I want to donate it or if I simply don’t want to wear it again. It helps me keep my wardrobe under control.
Marie-Aude is familiar with Google Analytics and integrates the quantitative data in her work. Here is what she has to say about the quantitative user data workshop:
Logging into GA with this knowledge is like entering a treasure vault: loads of valuable and juicy data are waiting for UX-lers to turn them into insights. Highly recommend taking this class to widen your skill-set.
Marie-Aude Ramos - Founder of User Wizard UX Career Mentoring
Curious to know what was in this workshop? Read on! You will find the complete contents of the workshop in the Google Slides embed at the bottom of this article.
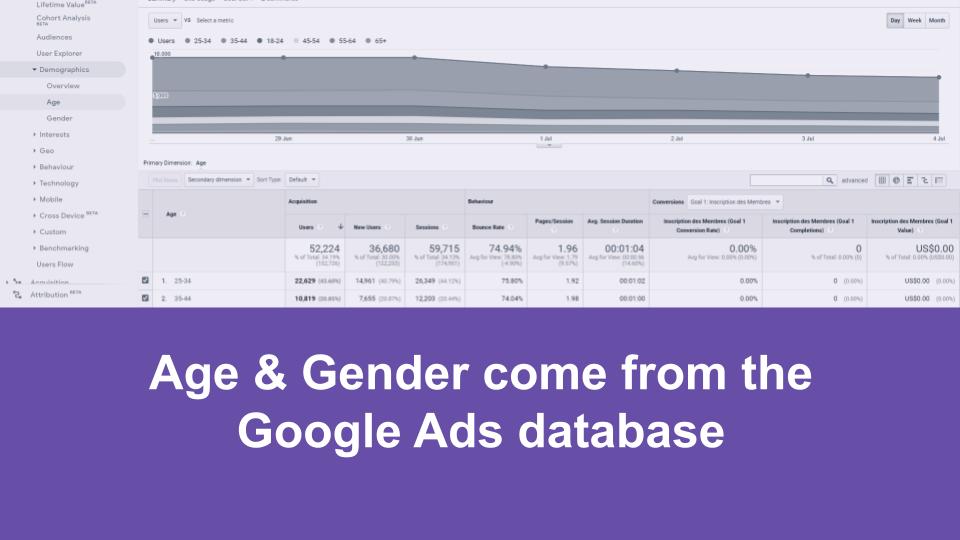
There is a report for this. You can go in Google Analytics and find some information. Where does this information come from? Google Ads. Google Ads is an advertising platforms that tracks a lot of data, including age and gender. If you share your data with the platform (you have to agree to it, it is not done by default), you can get data for your visitors. This is very useful in some cases and in others, you won’t care about it. Me? I was very confused when I saw most of my audience were women of varying ages. Why? Because I was advertising for sleep apnea products for men over 40 years old. Turns out that when someone snores really loud, it’s often the person hearing the snoring that calls the clinic!

Turns out that you can start identifying some common trends right in Google Analytics. Here is what I like to look into when trying to figure out what my visitors do and think about before they land in my website:

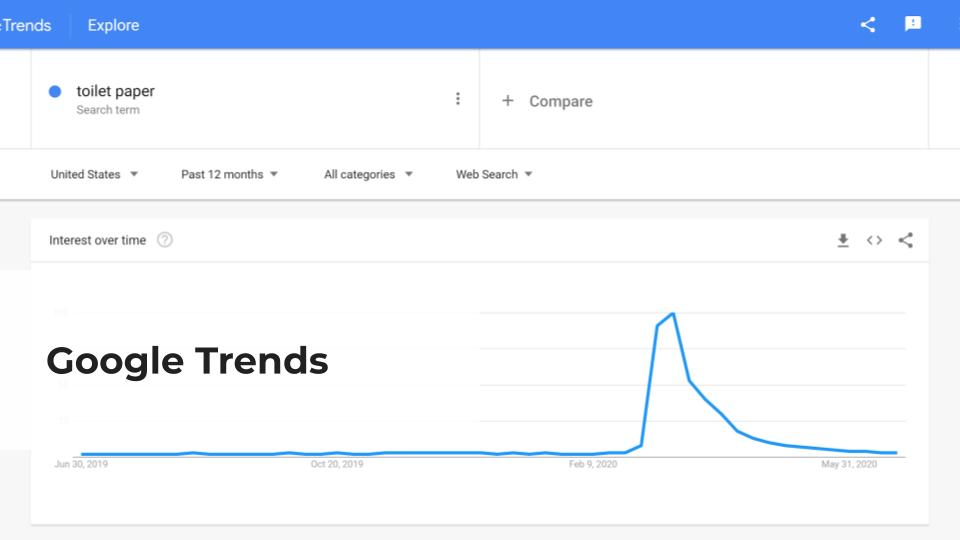
My favorite free tools to figure this out are : Google autocomplete, Google Trends and Google Search Console
About the author
Myriam Jessier
SEO & GEO Consultant, Advisor to Pragm
Myriam Jessier co-founded Pragm and stepped back from the day-to-day team a few years ago. They now act as Pragm's GEO consultant and SEO strategist, advising the agency from outside.
Need some help figuring out some things in Google Analytics? We've got you covered with this comprehensive Google Analytics Glossary.

We explain UTM links: how to create them, use them and analyze the data in Google Analytics. This is a useful guide if you want to figure UTMs out.